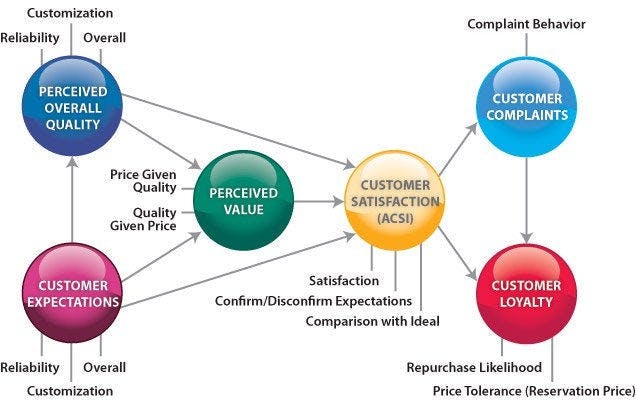
The ACSI Score is just one of five multi-item scales that make up the expanded model of the American Customer Satisfaction Index. Each multi-item scale represents a different aspect of customer attitudes: Customer Expectations, Perceived Overall Quality, Perceived Value, Customer Satisfaction and Customer Loyalty (Customer Complaints, shown in the graphic below, is based on a single question).

The American Customer Satisfaction Index has greater predictive validity than most other customer-satisfaction measures.
- Macroeconomically, ACSI has been shown to correlate to GDP and PCE (Personal Consumption Expenditure) growth (“The Effect of Buyer Satisfaction on Consumer Spending Growth”, Fornell & Rust, 2005).
- Microeconomically, ACSI predicts stock market performance for indices as well as individual stocks and even correlates to CEO bonuses.
Since the ACSI was started in 1994 and is used as a benchmark measuring changes to satisfaction over time, the underlying model has not been changed significantly despite subsequent research into its shortcomings. Most of the following criticisms are from “The evolution and future of national customer satisfaction index models” (Johnson, Gustafsson, Andreassen, Cha; 2001).
- No WOM/Recommendation Index – By contemporary standards, the model is remiss in that in leaves out any measurement of positive word of mouth. Early word-of-mouth research focused on complaining behavior (Gronhaug and Kvitastein, 1991; Singh, 1988), as does the ACSI model. Starting in 1991 and popularized in 1995, WOM research has shifted to recommendations and customer advocacy (Brown et al., 2005; Christopher et al., 1991; Jones and Sasser, 1995).
- Complaints are a Driver not Consequence of Satisfaction – When the ACSI model was first constructed, there was little awareness of the effects of complaint resolution on satisfaction. Complaints are in the wrong place in the model (Johnson, et al; 2001).
- Satisfaction as an Intermediary – The effects of Quality, Value and Expectations on Loyalty are all mediated by the cumulative satisfaction index. In reality, Quality and Value most likely directly affect Loyalty without going through Satisfaction, as this explains how Satisfaction and Loyalty can diverge. Value, in particular, is important when a customer re-evaluates whether to remain loyal (Johnson, et al; 2001).
- Expectations’ Effect on Cumulative Satisfaction – The link from the Expectations index to the Perceived Value index is weak, as is the link to the Customer Satisfaction index. Expectations correlate to Satisfaction less closely as time from initial transaction increases. This index can be safely omitted and in fact is omitted from the revised Norwegian Customer Satisfaction Barometer.
- Link from Quality to Value Problematic – This link has no sound theoretical basis (Johnson, et al; 2001).
- Value and Quality Indices Overlap – By creating a separate Price Index, Value can be removed and better correlations obtained (Johnson, et al; 2001).
- Uses Partial Least Squares for SEM – See “Customer Satisfaction in a Reduced Rank Regression Framework”, Pietro Giorgio Lovaglio, 2004.
- FID (Fuzzy Influence Diagrams) May Outperform SEM (Structural Equation Modeling) – FID has only recently been applied to the measurement of customer satisfaction and seems to outperform SEM “in solving the problems of nonlinearity, validity and causality” (Na An, Jinlan Liu, Yin Bai, 2007).
The expanded ACSI model would be a great foundation for another academic organization to use to build a modern customer satisfaction and loyalty model, unconstrained by the need for complete backward compatibility.

