You Don’t Need to be an Archaeologist to Uncover Hidden Data Insights


Archeologists use shovels, trowels, brushes, sieves, and buckets to do the tedious job of excavating the dirt to find the gems and hidden treasures beneath. They are highly trained not only in how to use the tools, but also where to dig. And often they have to dig in many different places to find the full scope of treasures and historical artifacts they seek.
Traditional Business Intelligence (BI) tools have required highly trained data scientists to sift through your organization’s data to find the insights you need to drive change and improvements. And like archeological digs, the data is housed in different, siloed systems and locations, making it difficult to unify and access all your data for analysis.
And one of the biggest limitations to BI tools is you have to know what to look for or ask.
Data Insights Are Unearthed with AI
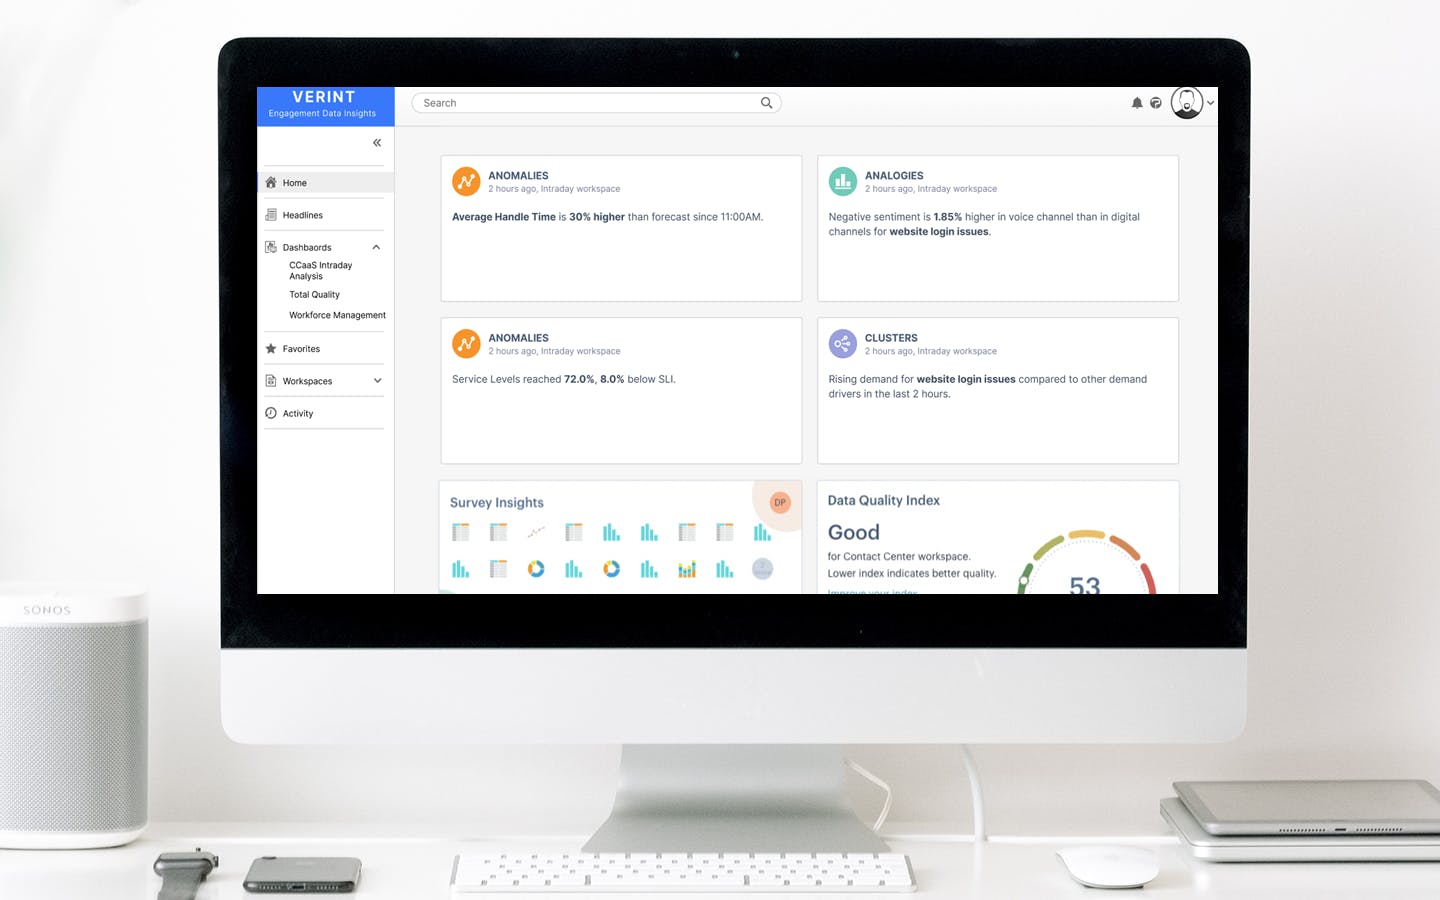
What if you had an AI-powered “bot” that unearthed anomalies in your contact center such as unexpectedly high handle times, or a dip in service levels, or an increase in negative sentiment?
What if these anomalies were presented to you in a dynamic, intraday reporting dashboard so you could make changes on the fly to adjust your operations in response to what’s happening in near real time?
This is what the Verint Data Insights Bot, part of Verint Engagement Data Insights solution, can do for you.
How? Well first, the Data Insights Bot is built on the Verint Engagement Data Hub, which unifies all your engagement data into a single repository, including:
- Omnichannel interaction data (voice, chat, email, in person, SMS texts, social, etc.)
- Customer and employee experience data (structured and unstructured feedback)
- Workforce performance data (human and bots).
Second, the bot, powered by Verint Da Vinci™ AI, can proactively surface insights without the user having to ask. Verint Engagement Data Insights gives the business user or manager easy, self-service access to all their engagement data.
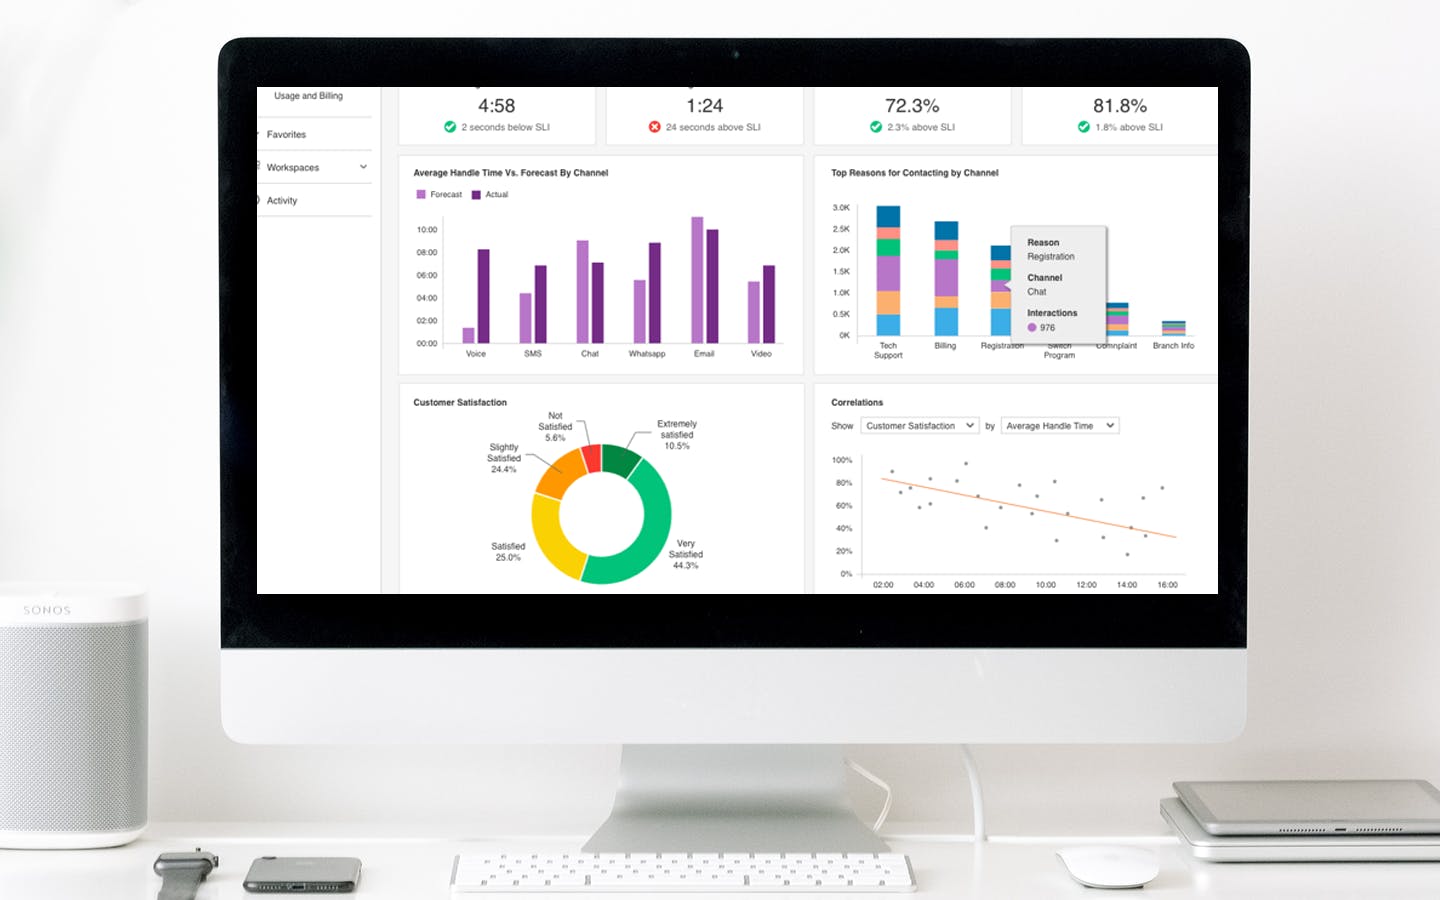
The intuitive and customizable dashboards visualize the data in a way that’s easy to understand and enables natural language search for deeper analysis and root cause discovery.
Let me give you an example.
One Contact Center Manager’s Story
Meet Tyesha. She’s the afternoon shift manager in a contact center for a small eCommerce retailer with 100 agents handling orders and service requests. Tyesha has named her Data Insights Bot Indy, after Indiana Jones, because he can unearth buried treasures in her engagement data.

Uncovering an Anomaly
Tyesha starts her day by checking her Verint Engagement Data Insights dashboard. Indy, her Data Insights Bot, has unearthed a problem. She can see on her dashboard that the average handle time (AHT) is 30% higher than forecasted and has been since 11 a.m. This is an hour old insight, and one Tyesha would not have been aware of if it weren’t for Indy.

Digging Deeper
Now Tyesha is not a data analyst, nor does she have any coding or IT experience. Yet using the natural language search function in the dashboard, she can ask questions to try to uncover the cause of the high AHT. Tyesha types into the search field: “What is the AHT by shift compared with forecast?”

From the resulting chart, visualizing the data in an easy-to-read format, she can see the trend is rising.
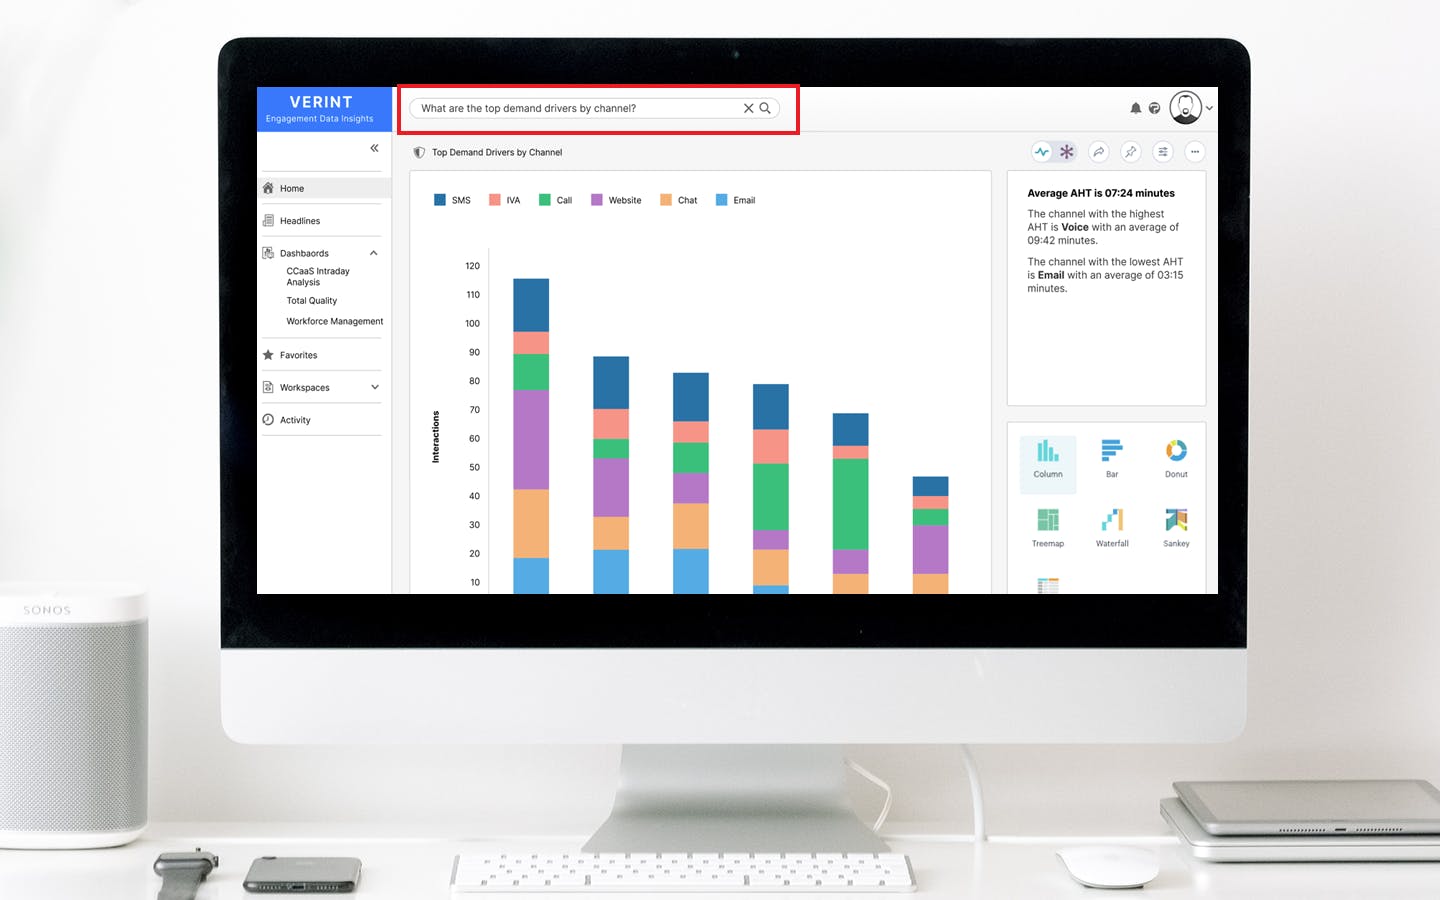
Tyesha next asks, “What are the top domain drivers by channel?” and sees that log-in issues are the top driver of demand, with the website being the highest-volume channel for that issue.

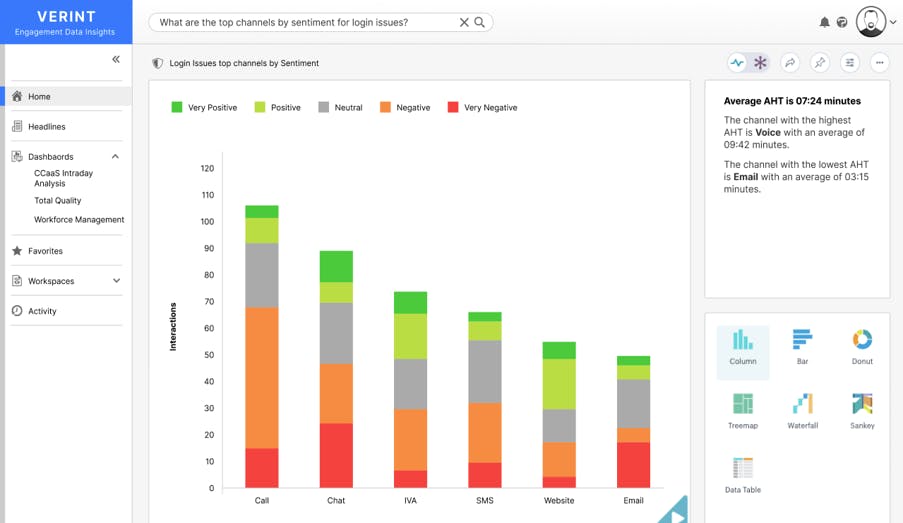
Now it’s no surprise log-in issues frustrate customers. But how badly is it impacting customer sentiment? Tyesha types in “What are the top channels by sentiment for log-in issues?”

Tyesha sees that for voice interactions, there is a lot of negative sentiment. Now Tyesha understands the root cause of the issue and is ready to take action.
Taking Action
First, Tyesha goes into her forecasting and scheduling application to see if she can free up time for her agents to help cover the increase in call volumes due to log in issues. She cancels a scheduled team meeting so those attendees can take calls. But this is only a temporary fix.
Next, Tyesha hits the collaborate button.
Tyesha selects the colleague she wants to alert—Joey from IT—and types him a quick message. The solution immediately sends this notification with the context to Joey. Tyesha can also create an automated, narrated video to share with Joey and anyone else who can help.
She goes into her dashboard and hits analyze further, which wraps up the information and runs through different points of the analysis process. What’s more, Tyesha can create a compelling, easy-to-understand explanation of the issue: she can turn the report into a video presentation and add commentary to provide additional value and insights without any video editing skills.
Uncovered Insights Drive Faster, Better Business Outcomes
As I pointed out earlier, traditional BI tools can only get you so far. They typically leverage only a portion of your data, can require data analysts or specialists to review and cull out the insights, and often deliver these insights hours or days after an event.
With Verint Engagement Data Insights and the Data Insights Bot, insights and anomalies are uncovered in near real time, unearthing problems and giving your managers the ability to drill down to discover the root cause of the issue—and take immediate action.
And the ability to seamlessly share these insights and to collaborate with colleagues means you can resolve issues faster, with less effort.
Want to learn more? Request a demo!